Monitoring Server Mengguakan Node Exporter
Introduction
Dalam mengelola infrastruktur server, visibilitas terhadap performa sistem adalah kunci utama untuk menjaga stabilitas layanan. Tanpa adanya metrics yang jelas mengenai penggunaan CPU, RAM, Disk Storage, tim teknisi akan kesulitan mendeteksi anomali sebelum menjadi masalah besar. Di sinilah Prometheus Node Exporter hadir sebagai solusi untuk masalah tersebut.
Node Exporter bertindak sebagai agent yang bertugas mengumpulkan seluruh metrics pada Hardware dan OS. Metrik-metrik ini nantinya akan ditarik (scraped) oleh Prometheus untuk dianalisis atau divisualisasikan melalui Grafana. Dalam artikel ini, kita akan membahas langkah demi langkah cara menginstal dan mengonfigurasi Node Exporter versi terbaru secara aman, efisien, dan siap untuk lingkungan produksi.
Installation
Step 1: Create user untuk node_exporter
sudo useradd --no-create-home --shell /bin/false node_exporter
Step 2: Download node_expoter dan pindahin ke /local/bin/
VERSION=$(curl -s https://api.github.com/repos/prometheus/node_exporter/releases/latest | grep tag_name | cut -d '"' -f 4)
wget https://github.com/prometheus/node_exporter/releases/download/${VERSION}/node_exporter-${VERSION#v}.linux-amd64.tar.gz
tar -xvf node_exporter-${VERSION#v}.linux-amd64.tar.gz
cd node_exporter-${VERSION#v}.linux-amd64

sudo cp node_exporter /usr/local/bin/
sudo chown node_exporter:node_exporter /usr/local/bin/node_exporter
Step 3: Buat password hash dari bcrypt untuk authenticatin ke metrics (bisa di skip jika tidak ingin menggunakan password)
cd ~
sudo apt install python3-bcrypt -y

cat << EOF > gen-pass.py
import getpass
import bcrypt

# 1. Meminta input password dari user
password = getpass.getpass("password: ")

# 2. Membuat hash bcrypt
hashed_password = bcrypt.hashpw(password.encode("utf-8"), bcrypt.gensalt())
hash_str = hashed_password.decode()

# 3. Menyusun format teks YAML yang Anda inginkan
config_content = f"""basic_auth_users:
  admin: {hash_str}
"""

# 4. Menulis dan menyimpan langsung ke file web-config.yml
nama_file = ".node-exporter"
with open(nama_file, "w") as file:
    file.write(config_content)

print(f"\n[Sukses] Hash berhasil dibuat dan langsung disimpan ke file '{nama_file}'!")
print("Berikut adalah isi filenya:")
print(config_content)
EOF
Step 4: Generate password menggunakan script yang sudah dibuat (bisa diskip jika tidak ingin menggunakan password)
python3 gen-pass.py
sudo mv .node-exporter /etc/
Step 5: Buat service untuk node expoter
sudo nano /etc/systemd/system/node_exporter.service
[Unit]
Description=Node Exporter
After=network.target
[Service]
User=node_exporter
Group=node_exporter
Type=simple
ExecStart=/usr/local/bin/node_exporter \
  --web.config.file=/etc/.node-exporter
[Install]
WantedBy=multi-user.target
Step 6: Restrict file config dan service kemudian restart service
sudo chown node_exporter:node_exporter /etc/.node-exporter
sudo chmod 600 /etc/.node-exporter
sudo chown node_exporter:node_exporter /etc/systemd/system/node_exporter.service

systemctl daemon-reload
systemctl enable node_exporter.service
systemctl restart node_exporter.service
Step 7: Allow ufw
sudo ufw allow 9100/tcp
Testing Node Exporter
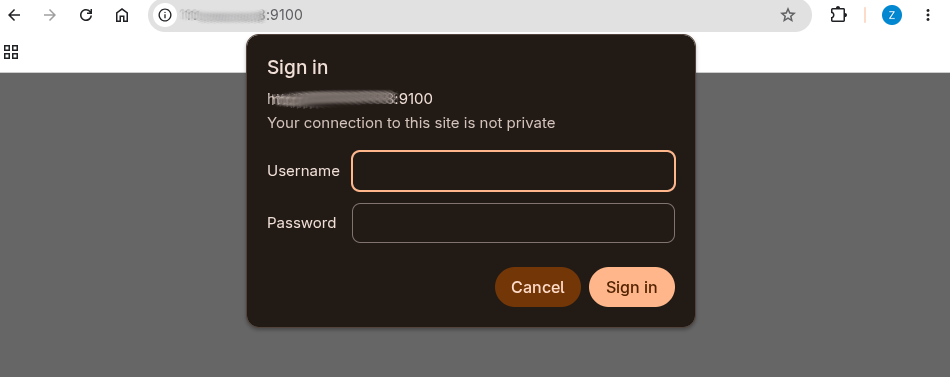
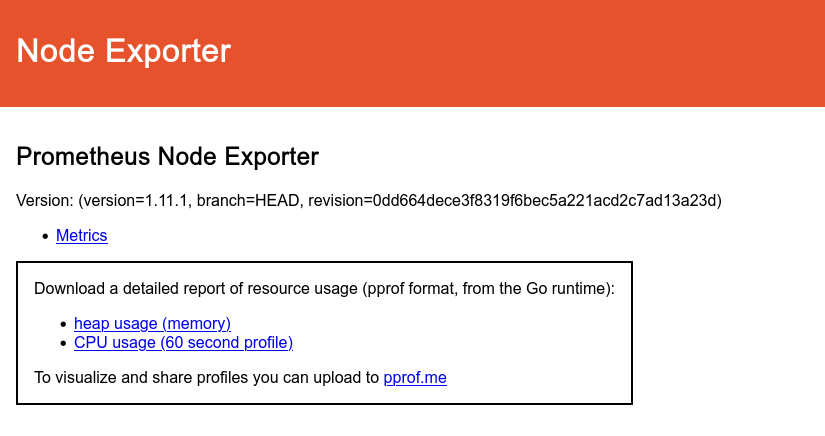
Sekarang kita coba akses ke <IPSERVER>:9100
Configuration Prometheus
Untuk konfigurasi prometheus.yml
scrape_configs:
  - job_name: 'Server'
    basic_auth:
      username: 'admin'
      password: 'YOURPASSWORD'
    static_configs:
      - targets: ['IPADDRESS:9100']
Dashboard Grafana
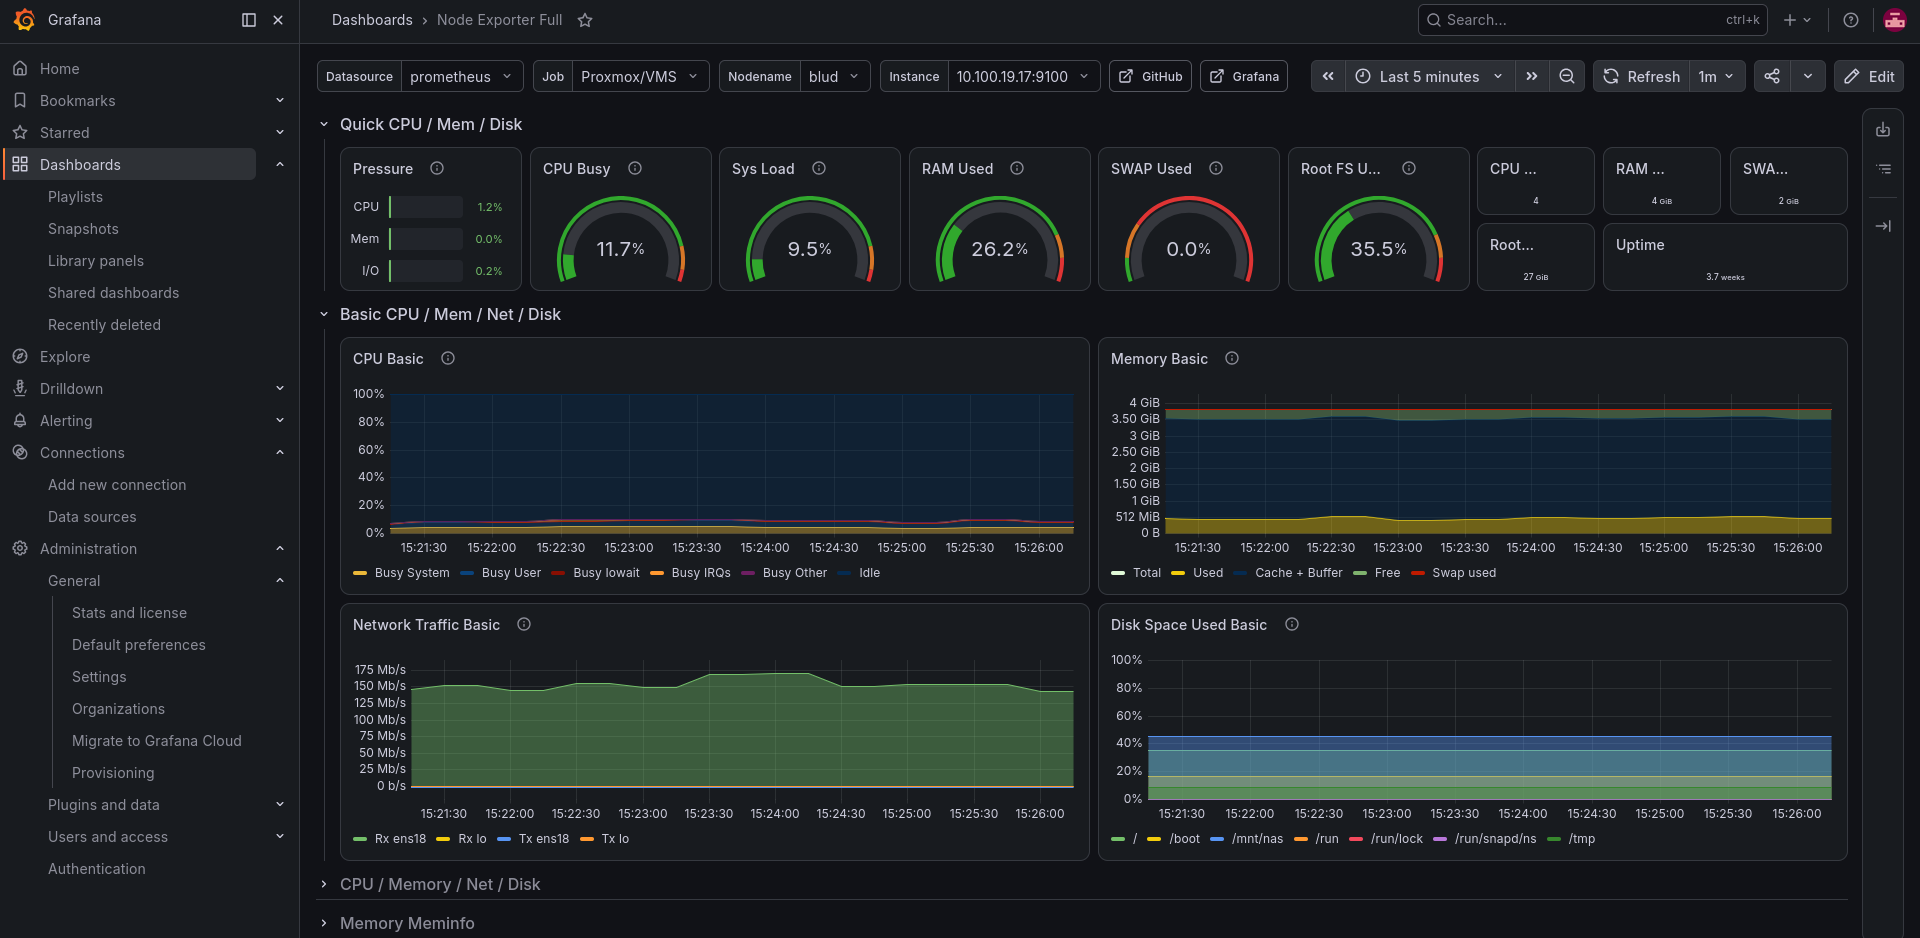
Kita cukup import UID 1860 ke dashboard nanti akan muncul seperti ini